HYDRODYNAMICS OF PUMPS
by
Christopher Earls Brennen © Concepts NREC 1994
CHAPTER 9.
UNSTEADY FLOW IN HYDRAULIC SYSTEMS
9.1 INTRODUCTION
This chapter is devoted to a description of the methods available
for the analysis of unsteady flows in pumps and their associated
hydraulic systems. There are two basic approaches to the solution of
unsteady internal flows: solution in the time domain or in the
frequency domain. The traditional time domain methods for hydraulic
systems are treated in depth elsewhere
(for example, Streeter and Wylie 1967,
1974), and will only be touched upon here.
They have the great advantage that they can incorporate the nonlinear
convective inertial terms in the equations of fluid flow, and are best
suited to evaluating the transient response of flows in long pipes in
which the equations of the flow and the structure are fairly well
established. However, they encounter great difficulties when either the
geometry is complex (for example inside a pump), or the fluid is complex
(for example in the presence of cavitation). Under these circumstances,
frequency domain methods have distinct advantages, both analytically and
experimentally. On the other hand, the nonlinear convective inertial
terms cannot readily be included in the frequency-domain methodology and,
consequently, these methods are only accurate for small perturbations from
the mean flow. This does permit evaluation of stability limits, but not
the evaluation of the amplitude of large unstable motions.
It should be
stressed that many unsteady hydraulic system problems can and should be
treated by the traditional time domain
or ``water-hammer'' methods.
However, since the focus of this monograph is on pumps and cavitation,
we place an emphasis here on frequency domain methods.
Sections 9.5 through 9.10 constitute an introduction to these frequency
domain methods. This is followed by a summary of the transfer functions
for simple components and for pumps, both noncavitating and cavitating.
Up to the beginning of section 9.15, it is assumed that the
hydraulic system is at rest in some inertial or nonaccelerating frame.
However, as indicated in section 8.13,
there is an important class
of problems in which the hydraulic system itself is oscillating in space.
In section 9.15,
we present a brief introduction to the treatment
of this class of problems.
9.2 TIME DOMAIN METHODS
The application of time domain methods to one-dimensional fluid flow
normally consists of the following three components. First, one
establishes conditions for the conservation of mass and momentum in the
fluid. These may be differential equations (as in the example in the next
section) or they may be jump conditions (as in the analysis of a shock).
Second, one must establish appropriate thermodynamic constraints
governing the changes of state of the fluid. In almost all practical
cases of single-phase flow, it is appropriate to assume that these changes
are adiabatic. However, in multiphase flows the constraints can be much more
complicated. Third, one must determine the response of the containing
structure to the pressure changes in the fluid.
The analysis is made a great deal simpler in those circumstances in which
it is accurate to assume that both the fluid and the structure behave
barotropically. By definition, this implies that
the change of state of
the fluid is such that some thermodynamic quantity (such as the entropy)
remains constant, and therefore the fluid density, ρ(p), is a simple
algebraic function of just one thermodynamic variable, for example the
pressure.
In the case of the structure, the assumption is that it deforms
quasistatically, so that, for example, the cross-sectional area of a pipe,
A(p), is a simple, algebraic function of the fluid pressure, p. Note
that this neglects any inertial or damping effects in the structure.
The importance of the assumption of a barotropic fluid and structure lies
in the fact that it allows the calculation of a single, unambiguous speed
of sound for waves traveling through the piping system.
The sonic speed
in the fluid alone is given by c∞ where
 | ......(9.1)
|
In a liquid, this is usually calculated from the bulk modulus,
κ = ρ/(dρ/dp), since
 | ......(9.2)
|
However the sonic speed, c, for one-dimensional waves in a fluid-filled
duct is influenced by the compressibility of both the liquid and the
structure:
 | ......(9.3)
|
or, alternatively,
 | ......(9.4)
|
The left-hand side is the acoustic impedance of the system, and the
equation reveals that this is the sum of the acoustic impedance of the
fluid alone, 1/ρc2∞, plus an
``acoustic impedance'' of the
structure given by (dA/dp)/A. For example, for a thin-walled pipe made
of an elastic material of Young's modulus, E, the acoustic impedance
of the structure is 2a/Eδ, where a and δ are the radius and
the wall thickness of the pipe (δ « a). The resulting form of
equation 9.4,
 | ......(9.5)
|
is known as the Joukowsky water hammer equation. It leads, for example,
to values of c of about 1000m/s for water in standard steel pipes
compared with c∞ of about 1400m/s. Other common expressions for
c are those used for thick-walled tubes, for concrete tunnels, or for
reinforced concrete pipes (Streeter and Wylie 1967).
9.3 WAVE PROPAGATION IN DUCTS
In order to solve unsteady flows in ducts, an expression for the sonic
speed is combined with the differential form of the equation for
conservation of mass (the continuity equation),
 | ......(9.6)
|
where u(s,t) is the cross-sectionally averaged or volumetric velocity,
s is a coordinate measured along the duct, and t is time. The
appropriate differential form of the momentum equation is
 | ......(9.7)
|
where gS is the component of the acceleration due to gravity in the s
direction, f is the friction factor, and a is the radius of the duct.
Now the barotropic assumption 9.3 allows the terms in
equation 9.6 to be written as
 | ......(9.8)
|
so the continuity equation becomes
 | ......(9.9)
|
Equations 9.7 and 9.9 are two simultaneous, first order, differential
equations for the two unknown functions, p(s,t) and u(s,t). They can
be solved given the barotropic relation for the fluid, ρ(p), the
friction factor, f, the normal cross-sectional area of the pipe,
A0(s), and boundary conditions which will be discussed later. Normally the
last term in equation 9.9 can be approximated by ρ u(dA0/ds)/A0. Note
that c may be a function of s.
In the time domain methodology, equations 9.7 and 9.9
are normally solved
using the method of characteristics (see, for example, Abbott 1966).
This involves finding moving coordinate systems in which the equations may
be written as ordinary rather than partial differential equations.
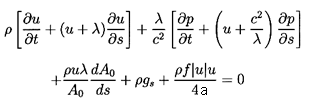
Consider the relation that results when we multiply equation 9.9 by
λ and add it to equation 9.7:
 | ......(9.10)
|
If the coefficients of ∂u/∂s and
∂p/∂s inside the square brackets were identical,
in other words if
λ = ± c, then the expressions in the square brackets could be
written as
 | ......(9.11)
|
and these are the derivatives du/dt and dp/dt on
ds/dt= u±c. These lines ds/dt= u±c
are the characteristics, and on them we may write:
-
In a frame of reference moving with velocity u+c or on
ds/dt=u+c:
 | ......(9.12)
|
- In a frame of reference moving with velocity u-c or on
ds/dt=u-c:
 | ......(9.13)
|
A simpler set of equations result if the piezometric head, h*, defined
as
 | ......(9.14)
|
is used instead of the pressure, p, in
equations 9.12 and 9.13. In almost all hydraulic problems of
practical interest p/ρL c2 « 1 and, therefore, the term
ρ-1 dp/dt in equations 9.12 and 9.13 may
be approximated by d(p/ρ)/dt. It follows that on the two characteristics
 | ......(9.15)
|
and equations 9.12 and 9.13 become
-
On ds/dt = u+c
 | ......(9.16)
|
-
On ds/dt = u-c
 | ......(9.17)
|
|
| Figure 9.1
Method of characteristics.
|
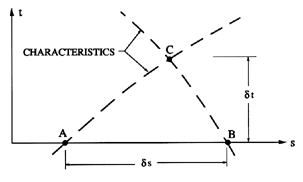
These are the forms of the equations conventionally used in unsteady hydraulic
water-hammer problems (Streeter and Wylie 1967). They are typically solved
by relating the values at a time t+δ t (for example point C of
figure 9.1)
to known values at the points A and B at time t. The lines
AC and BC are characteristics, so the following finite
difference forms of equations 9.16 and 9.17 apply:
 | ......(9.18)
|
and
 | ......(9.19)
|
If cA=cB=c, and the pipe is uniform, so that dA0/ds=0 and
fA=fB=f, then these reduce to the following expressions for uC and
h*C:
 | ......(9.20)
|
 | ......(9.21)
|
9.4 METHOD OF CHARACTERISTICS
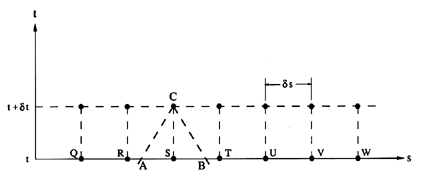
The typical numerical solution by the method of characteristics
is depicted graphically in figure 9.2. The time interval, δt,
and the spatial increment, δs, are specified. Then, given all
values of the two dependent variables (say u and h*) at one
instant in time,
one proceeds as follows to find all the values at points such as C at a
time δt later. The intersection points, A and B, of the
characteristics through C are first determined. Then interpolation
between the known values at points such as R, S and T are used to
determine the values of the dependent variables at A and B. The values
at C follow from equations such as
9.20 and 9.21 or some alternative
version. Repeating this for all points at time t+δt allows one
to march forward in time.
|
| Figure 9.2
Example of numerical solution by method of
characteristics.
|
There is, however, a maximum time interval, δt, that will lead to
a stable numerical solution. Typically this requires that δt
be less than δx/c. In other words, it requires that the
points A
and B of figure 9.2 lie inside of the interval RST. The reason
for this condition can be demonstrated in the following way.
Assume for the sake of simplicity that the slopes of the characteristics
are ±c; then the distances AS=SB=c δt. Using linear
interpolation to find uA and uB from uR, uS and uT leads to
 | ......(9.22)
|
Consequently, an error in uR of, say, δu
would lead to an error
in uA of c δu δt/δs (and similarly
for uT and uB). Thus the error would be
magnified with each time
step unless c δt/δs < 1 and, therefore, the numerical
integration is only stable if δt < δx/c. In many hydraulic
system analyses this places a quite severe restriction on the time
interval δt, and often necessitates a large number of time
steps.
A procedure like the above will also require boundary conditions to be
specified at any mesh point which lies either, at the end of a pipe or, at a
junction of the pipe with a pipe of different size (or a pump or any other
component). If the points S and C in figure 9.2 were end points,
then only one characteristic would lie within the pipe and only one
relation, 9.18 or 9.19,
can be used. Therefore, the boundary condition must provide a
second relation involving uC or h*C (or both). An example is an
open-ended pipe for which the pressure and, therefore, h* is known.
Alternatively, at a junction between two sizes of pipe, the two required
relations will come from one characteristic in each of the two pipes, plus
a continuity equation at the junction ensuring that the values of uA0
in both pipes are the same at the junction. For this reason it is
sometimes convenient to rewrite equations
9.16 and 9.17 in terms of
the volume flow rate Q=uA0 instead of u so that
-
On ds/dt=u+c
 | ......(9.23)
|
-
On ds/dt=u-c
 | ......(9.24)
|
Even in simple pipe flow, additional complications arise when the
instantaneous pressure falls below vapor pressure and cavitation
occurs. In the context of water-hammer analysis, this is known as
``water column separation'',
and is of particular concern because the
violent collapse of the cavity can cause severe structural damage
(see, for example, Martin 1978).
Furthermore, the occurrence of water column separation can trigger
a series of cavity formations and collapses, resulting in a series
of impulsive loads on the structure. The possibility of water
column separation can be tracked by following the instantaneous
pressure. To proceed beyond this point requires a procedure to
incorporate a cavity in the waterhammer calculation using the
method of characteristics. A number of authors (for example,
Tanahashi and Kasahara 1969, Weyler et al. 1971, Safwat and
van der Polder 1973) have shown that this is possible. However
the calculated results after the first collapse
can deviate substantially from the observations. This is probably
due to the fact that the first cavity is often a single, coherent
void. This will shatter into a cloud of smaller bubbles as a result
of the violence of the first collapse. Subsequently, one is dealing
with a bubbly medium whose wave propagation speeds may differ
significantly from the acoustic speed assumed in the analytical
model. Other studies have shown that qualitatively similar changes
in the water-hammer behavior occur when gas bubbles form in the liquid
as a result of dissolved gas coming out of solution
(see, for example, Wiggert and Sundquist 1979).
In many time domain analyses, turbomachines are
treated by assuming that the temporal rates
of change are sufficiently slow that the turbomachine responds
quasistatically, moving from one steady state operating point to
another. Consequently, if points A and B lie at inlet to and
discharge from the turbomachine then the equations relating the values at
A and B would be
 | ......(9.25)
|
 | ......(9.26)
|
where H(Q) is the head rise across the machine at the flow rate, Q.
Data presented later will show that the quasistatic assumption
is only valid for rates of change less than about one-tenth the
frequency of shaft rotation. For frequencies greater than this, the pump
dynamics become important (see section 9.13).
For more detailed accounts of the methods of characteristics the reader is
referred to Streeter and Wylie (1967), or any modern text on numerical
methods. Furthermore, there are a number of standard codes available for
time domain analysis of transients in hydraulic systems, such
as that developed by Amies, Levek and Struesseld (1977). The
methods work well so long as one has confidence in the differential
equations and models which are used.
In other circumstances, such as occur in two-phase flow, in
cavitating flow, or in the complicated geometry of a turbomachine, the time
domain methods may be less useful than the alternative frequency domain
methods to which we now turn.
9.5 FREQUENCY DOMAIN METHODS
When the quasistatic assumption for a device like a pump or turbine
becomes questionable, or when the complexity of the fluid or the
geometry makes the construction of a set of differential equations
impractical or uncertain, then it is clear that experimental information
on the dynamic behavior of the device is necessary. In practice, such
experimental information is most readily obtained by subjecting the device
to fluctuations in the flow rate or head for a range of frequencies, and
measuring the fluctuating quantities at inlet and discharge. Such
experimental results will be presented later. For present purposes it is
sufficient to recognize that one practical advantage of frequency domain
methods is the capability of incorporation of experimentally obtained
dynamic information and the greater simplicity of the experiments
required to obtain the necessary dynamic data.
Another advantage, of course, is the core of
fundamental knowledge that exists regarding such methodology
(see for example, Pipes 1940, Hennyey 1962, Paynter 1961, Brown 1967).
As stated earlier, the disadvantage is that the methods are limited
to small linear perturbations in the flow rate. When the perturbations
are linear, Fourier analysis and synthesis
can be used to convert from transient data to individual frequency
components and vice versa.
All the dependent variables such as the mean velocity, u, mass flow
rate, m, pressure, p, or total pressure, pT, are expressed as
the sum of a mean component (denoted by an overbar) and a complex fluctuating
component (denoted by a tilde) at a frequency,
ω, which incorporates the amplitude and phase of the fluctuation:
 | ......(9.27)
|
 | ......(9.28)
|
 | ......(9.29)
|
where j is (-1)½ and Re denotes
the real part. Since the perturbations are assumed linear
(| | «
| «
 ,
|
,
|  | «
| «
 , etc.), they can be readily
superimposed,
so a summation over many frequencies is implied in the above expressions.
In general, the perturbation quantities will be functions of the mean flow
characteristics as well as position, s, and frequency, ω.
We should note that there do exist a number of codes designed to examine
the frequency response of hydraulic systems using frequency domain
methods (see, for example, Amies and Greene 1977).
9.6 ORDER OF THE SYSTEM
The first step in any unsteady flow analysis is to subdivide the system
into components; the points separating two (or more) components will be
referred to as system nodes. Typically, there would
be nodes at the inlet
and discharge flanges of a pump. Having done this, it is necessary to
determine the order of the system, N, and this can be
accomplished in
one of several equivalent ways. The order of the system is the minimum
number of independent fluctuating quantities which must be specified at a
system node in order to provide a complete description of
the unsteady flow at that location. It is also
equal to the minimum number of independent, simultaneous first order
differential equations
needed to describe the fluid motion in, say, a length of pipe. In this
summary we shall confine most of our discussion to systems of order two in
which the dependent variables are the mass flow rate and either the
pressure or the total head. This includes most of the common analyses of
hydraulic systems. It is, however, important to recognize that order two
systems are confined to
-
Incompressible flows at the system nodes, definable by pressure
(or head), and flow rate.
-
Barotropic compressible flows in which, ρ(p), so only
the pressure (or head) and flow rate need be specified at system nodes.
This category also includes those flexible structures for
water-hammer analysis in which the local area is a function only of the
local pressure. If, on the other hand, the local area depends on the area
and the pressure elsewhere, then the system is of order 3 or higher.
-
Two-phase flows at the system nodes that can be represented by
a homogeneous flow model that
neglects the relative velocity
between the phases. Any of the more accurate models that allow relative
motion produce higher order systems.
Note that the order of the system can depend on the choice of
system nodes. Consequently, an ideal evaporator or a condenser can
be incorporated in an order two system provided the flow at the inlet node
is single-phase (of type 2) and the flow at the discharge node
also single-phase. A cavitating pump or turbine also
falls within this category, provided the flow at both
the inlet and discharge is pure liquid.
9.7 TRANSFER MATRICES
The transfer matrix for any component or device is the matrix which
relates the fluctuating quantities at the discharge node to the
fluctuating quantities at the inlet node. The earliest exploration
of such a concept in electrical networks appears to be due to
Strecker and Feldtkeller (1929) while the utilization of the idea in
the context of fluid systems owes much to the pioneering work of
Pipes (1940). The concept is the following. If the quantities at inlet and
discharge are denoted by subscripts i=1 and i=2,
respectively, and, if
{ }, n=1,2→ N denotes the vector of independent
fluctuating quantities at inlet and discharge for a system of order N,
then the transfer matrix, [T], is defined as
 | ......(9.30)
|
It is a square matrix of order N. For example, for an order
two system in which the independent fluctuating variables are chosen to be
the total pressure,
 , and the mass flow rate,
 ,
then a convenient transfer matrix is
 | ......(9.31)
|
The words transfer function and transfer matrix are used
interchangeably here to refer to the matrix [T]. In general it will be
a function of the frequency, ω, of the perturbations and the mean
flow conditions in the device.
The most convenient independent fluctuating quantities for a hydraulic
system of order two are usually
-
Either the pressure,
 , or the instantaneous total
pressure,
 . Note that these are
related by
 | ......(9.32)
|
where
 is the mean density,
 is the
fluctuating density which is barotropically connected to
 , and
z is the vertical elevation of the system node. Neglecting the
 terms as is acceptable for
incompressible flows
 | ......(9.33)
|
-
Either the velocity,
 ,
the fluctuating volume flow rate or the fluctuating mass flow rate,
 .
Incompressible flow at a system node in a rigid pipe implies
 | ......(9.34)
|
The most convenient choices are
{ ,
,
 } or
{
 ,
,
 }, and, for these two vectors,
we will respectively use transfer matrices denoted by [T*] and
[T], defined as
 | ......(9.35)
|
If the flow is incompressible and the cross-section at the nodes is rigid,
then the [T*] and [T] matrices are clearly connected by
 | ......(9.36)
|
and hence one is readily constructed from the other. Note
that the determinants of the two matrices, [T] and [T*],
are identical.
9.8 DISTRIBUTED SYSTEMS
In the case of a distributed system such as a pipe, it is also appropriate
to define a matrix [F] (see Brown 1967) so that
 | ......(9.37)
|
Note that, apart from the frictional term, the
equations 9.12 and 9.13
for flow in a pipe will lead to perturbation equations of this form.
Furthermore, in many cases the frictional term is small, and can be
approximated by a linear term in the perturbation equations; under such
circumstances the frictional term will also fit into the form given by
equation 9.37.
When the matrix [F] is independent of location, s, the distributed
system is called a ``uniform system''
(see section 9.10). For
example, in equations
9.12 and 9.13, this would require ρ, c, a, f
and A0 to be approximated as constants (in addition to the
linearization of the frictional term). Under such circumstances, equation
9.37 can be integrated over a finite length, ℓ , and the transfer
matrix [T] of the form 9.35 becomes
 | ......(9.38)
|
where e[F]ℓ is known as the
``transmission matrix.'' For a
system of order two, the explicit relation between [T] and [F] is
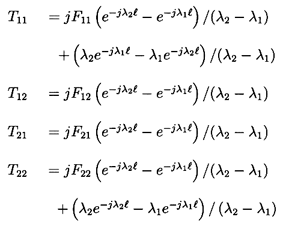 | ......(9.39)
|
where λ1, λ2 are the solutions of the equation
 | ......(9.40)
|
Some special features and properties of these transfer functions will be
explored in the sections which follow.
9.9 COMBINATIONS OF TRANSFER MATRICES
When components are connected in series, the transfer matrix for the
combination is clearly obtained by multiplying the transfer matrices of
the individual components in the reverse order in which the flow passes
through them. Thus, for example, the combination of a pump with a
transfer matrix, [TA], followed by a discharge line with a transfer matrix,
[TB], would have a system transfer matrix, [TS], given by
 | ......(9.41)
|
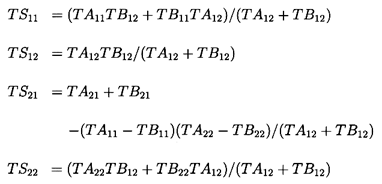
The parallel combination of two components is more complicated and
does not produce such a simple result. Issues arise concerning the
relations between the pressures of the inlet
streams and the relations between the pressures of the discharge streams.
Often it is appropriate to assume that the branching which creates the
two inlet streams results in identical fluctuating total pressures at
inlet to the two components,
 .
If, in addition, mixing losses at the downstream junction are neglected,
so that the fluctuating total pressure,
 , can be equated with
the fluctuating total pressure at discharge from the two components, then
the transfer function, [TS], for the combination of two components
(order two transfer functions denoted by [TA] and [TB])
becomes
 | ......(9.42)
|
On the other hand, the circumstances at the junction of the two discharge
streams may be such that the fluctuating static pressures (rather than the
fluctuating total pressures) are equal. Then, if the inlet static pressures
are also equal, the combined transfer matrix, [TS*], is related to those
of the two components ([TA*] and [TB*]) by the same relations as
given in equations 9.42. Other combinations of choices are possible,
but will not be detailed here.
Using the above combination rules, as well as the relations 9.36
between the [T] and [T*] matrices, the transfer functions for
very complicated hydraulic networks can be systematically synthesized.
9.10 PROPERTIES OF TRANSFER MATRICES
Transfer matrices (and transmission matrices) have some fundamental
properties that are valuable to recall when constructing or evaluating
the dynamic properties of a component or system.
We first identify a ``uniform'' distributed component as one in which
the differential equations
(for example, equations 9.12 and 9.13 or 9.37)
governing the fluid motion have coefficients which are independent of
position, s. Then, for the class of systems represented by the equation
9.37, the matrix [F] is independent of s. For a system of
order two, the transfer function [T] would take the explicit form given
by equations 9.39.
To determine another property of this class of dynamic systems, consider
that the equations 9.37 have been manipulated to eliminate all
but one of the unknown fluctuating quantities, say
 . The resulting equation
will take the form
 | ......(9.43)
|
In general, the coefficients an(s), n=0→ N, will be complex
functions of the mean flow and of the frequency. It follows that there
are N independent solutions which, for all the independent fluctuating
quantities, may be expressed in the form
 | ......(9.44)
|
where [B(s)] is a matrix of complex solutions and {A} is a vector of
arbitrary complex constants to be determined from the boundary conditions.
Consequently, the inlet and discharge fluctuations denoted by subscripts 1
and 2, respectively, are given by
 | ......(9.45)
|
and therefore the transfer function
 | ......(9.46)
|
Now for a uniform system, the coefficients an and the matrix [B] are
independent of s. Hence the equation 9.43 has a solution of the form
 | ......(9.47)
|
where [C] is a known matrix of constants, and [E] is a diagonal matrix
in which
 | ......(9.48)
|
where γn, n=1 to N, are the solutions of the dispersion relation
 | ......(9.49)
|
Note that γn
are the wavenumbers for the N types of wave of frequency, ω,
which can propagate through the uniform system. In general, each of these
waves has a distinct wave speed, cn, given by cn=-ω/γn.
It follows from equations
9.47, 9.48 and 9.46 that the transfer matrix for a
uniform distributed system must take the form
 | ......(9.50)
|
where [E*] is a diagonal matrix with
 | ......(9.51)
|
and ℓ =s2-s1.
An important diagnostic property arises from the form of the transfer
matrix, 9.50, for a uniform distributed system.
The determinant, DT, of the transfer matrix
[T] is
 | ......(9.52)
|
Thus the value of the determinant is related to the sum of the wavenumbers
of the N different waves which can propagate through the uniform
distributed system. Furthermore, if all the wavenumbers, γn, are
purely real, then
 | ......(9.53)
|
The property that the modulus of the determinant of the
transfer function is unity will be termed ``quasi-reciprocity'' and
will be discussed further below. Note that this will only be the case in
the absence of wave damping when γn and cn are purely real.
Turning now to another property, a system is said to be ``reciprocal'' if, in
the matrix [Z] defined by
 | ......(9.54)
|
the transfer impedances Z12 and Z21 are identical (see Brown
1967 for the generalization of this property in systems of higher order).
This is identical to the condition that the
determinant, DT, of the
transfer matrix [T] be unity:
 | ......(9.55)
|
We shall see that a number of commonly used components have
transfer functions which are reciprocal.
In order to broaden the perspective we have introduced the property
of ``quasi-reciprocity'' to
signify those components in which the modulus
of the determinant is unity or
 | ......(9.56)
|
We have already noted that uniform distributed components with purely real
wavenumbers are quasi-reciprocal. Note that a uniform distributed
component will only
be reciprocal when the wavenumbers tend to zero, as, for example, in
incompressible flows in which the wave propagation speeds tend to infinity.
By utilizing the results of section 9.9
we can conclude that any series or
parallel combination of reciprocal components will yield a reciprocal
system. Also a series combination of quasi-reciprocal components will be
quasi-reciprocal. However it is not necessarily true that a parallel
combination of quasi-reciprocal components is quasi-reciprocal.
An even more restrictive property than reciprocity is the property of
``symmetry''. A ``symmetric'' component
is one that has identical dynamical
properties when turned around so that the discharge becomes the inlet, and
the directional convention of the flow variables is reversed (Brown
1967). Then, in contrast to the regular transfer matrix, [T], the
effective transfer matrix under these reversed circumstances is
[TR] where
 | ......(9.57)
|
and, comparing this with the definition 9.31, we observe that
 | ......(9.58)
|
Therefore symmetry, [T]=[TR], requires
 | ......(9.59)
|
Consequently, in addition to the condition, DT=1, required for
reciprocity, symmetry requires T11=T22.
As with the properties of reciprocity and quasi-reciprocity, it is useful
to consider the property of a system comprised of symmetric components.
Note that according to the combination rules of
section 9.9, a parallel
combination of symmetric components is symmetric, whereas a series
combination may not retain this property. In this regard symmetry is in
contrast to quasi-reciprocity in which the reverse is true.
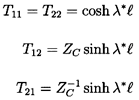
In the case of uniform distributed systems, Brown (1967) shows that
symmetry requires
 | ......(9.60)
|
so that the solution of the equation 9.40 for λ is
λ=±λ*
where λ*=(F21F12)½ is known as the
``propagation operator'' and the transfer
function 9.39 becomes
 | ......(9.61)
|
where ZC=(F12/F21)½=(T12/T21)½ is known
as the ``characteristic impedance''.
In addition to the above properties of transfer functions, there are also
properties associated with the net flux of fluctuation energy into the
component or system. These will be elucidated after we have examined some
typical transfer functions for components of hydraulic systems.
9.11 SOME SIMPLE TRANSFER MATRICES
The flow of an incompressible fluid in a straight, rigid pipe will be
governed by the following versions of
equations 9.6 and 9.7:
 | ......(9.62)
|
 | ......(9.63)
|
If the velocity fluctuations are small compared with the mean velocity
denoted by U (positive in direction from inlet to discharge), and the
term u| u| is linearized, then the above equations lead
to the transfer function
 | ......(9.64)
|
where (R+jωL) is the ``impedance'' made up of a
``resistance'', R,
and an ``inertance'', L, given by
 | ......(9.65)
|
where A, a, and ℓ are the cross-sectional area, radius, and
length of the pipe. A number of different pipes in series would then have
 | ......(9.66)
|
where Q is the mean flow rate. For a duct of non-uniform area
 | ......(9.67)
|
Note that all such ducts represent reciprocal and symmetric
components.
A second, common hydraulic element is a simple
``compliance'', exemplified by
an accumulator or a surge tank.
It consists of a device installed in a
pipeline and storing a volume of fluid, VL, which varies with the local
pressure, p, in the pipe. The compliance, C, is defined by
 | ......(9.68)
|
In the case of a gas accumulator with a mean volume of gas,
 ,
which behaves according to the polytropic index, k, it follows that
 | ......(9.69)
|
where  is the mean pressure
level. In the case of a surge tank in
which the free surface area is AS, it follows that
 | ......(9.70)
|
The relations across such compliances are
 | ......(9.71)
|
Therefore, using the definition 9.35, the transfer
function [T] becomes
 | ......(9.72)
|
Again, this component is reciprocal and symmetric, and is
equivalent to a capacitor to ground in an electrical circuit.
Systems made up of lumped resistances, R, inertances, L, and
compliances, C, will be termed
LRC systems.
Individually, all three of
these components are both reciprocal and symmetric. It follows that any
system comprised of these
components will also be reciprocal
(see section 9.10); hence all LRC
systems are reciprocal. Note also that, even though individual components
are symmetric, LRC systems are not symmetric since series combinations are
not, in general, symmetric (see section 9.10).
An even more restricted class of systems are those consisting only of
inertances, L, and compliances, C. These systems are termed
``dissipationless'' and have some special
properties (see, for example, Pipes 1963) though
these are rarely applicable in hydraulic systems.
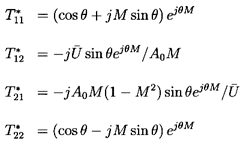
As a more complicated example, consider the frictionless (f=0)
compressible flow in a
straight uniform pipe of mean cross-sectional area, A0.
This can readily be shown to have the transfer function
 | ......(9.73)
|
where  is the mean fluid
velocity,
M=
 /c is the Mach
number, and θ is a reduced frequency given by
 | ......(9.74)
|
Note that all the usual acoustic responses can be derived quite simply
from this
transfer function. For example, if the pipe opens into reservoirs at
both ends, so that the fluctuating pressures
at inlet and discharge are zero
then the transfer function, equation 9.35, can only be
satisfied with zero inlet fluctuating mass flow
if T*12=0. According to
equations 9.73, this can only occur if
sin θ=0, θ=nπ or
 | ......(9.75)
|
which are the natural organ-pipe modes
for such a pipe. Note also that
the determinant of the transfer matrix is
 | ......(9.76)
|
Since no damping has been included, this component is an undamped
distributed system, and is therefore quasi-reciprocal.
At low frequencies and Mach numbers, the
transfer function 9.73 reduces to
 | ......(9.77)
|
and so consists of an inertance, ℓ /A0, and a compliance,
A0ℓ /c2.
When friction is included (as is necessary in most water-hammer analyses)
the transfer function becomes
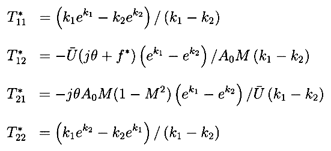 | ......(9.78)
|
in which f*=fℓ M/2a(1-M2) and k1,k2 are the solutions of
 | ......(9.79)
|
The determinant of this transfer matrix [T*] is
 | ......(9.80)
|
Note that this component is only quasi-reciprocal in the undamped limit,
f→0.
9.12 FLUCTUATION ENERGY FLUX
It is clearly important to be able to establish the net energy flux into or
out of a hydraulic system component (see Brennen and Braisted 1980).
If the fluid is incompressible, and
the order two system is characterized by the mass flow rate, m, and the
total pressure, pT, then the instantaneous energy flux through any system
node is given by mpT/ρ where the density is assumed constant.
Substituting
the expansions 9.28, 9.29
for pT and m, it is readily seen that the
mean flux of energy due to the fluctuations, E, is given by
 | ......(9.81)
|
where the overbar denotes a complex conjugate. Superimposed on E are
fluctuations in the energy flux whose time-average value is zero, but we
shall not be concerned with those fluctuations. The mean
fluctuation energy flux, E, is of more consequence in terms, for
example, of evaluating stability. It follows that the net flux of
fluctuation energy into a component from the fluid is given by
 | ......(9.82)
|
and when the transfer function form 9.31 is used to write this in terms
of the inlet fluctuating quantities
 | ......(9.83)
|
where
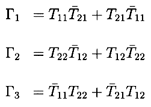 | ......(9.84)
|
and
 | ......(9.85)
|
Using the above relations, we can draw the following conclusions:
-
A component or system which is
``conservative'' (in the sense that
ΔE=0 under all circumstances, whatever the values of
the inlet fluctuating total pressure and mass flow rate)
requires that
 | ......(9.86)
|
and these in turn require not only that the system or component be
``quasi-reciprocal'' (| DT| =1) but also that
 | ......(9.87)
|
Such conditions virtually never occur in real hydraulic systems,
though any combination of lumped inertances and compliances does constitute
a conservative system. This can be readily demonstrated as follows.
An inertance or compliance has
DT=1, purely real T11 and
T22 so that
T11= and
T22=
 ,
and purely imaginery T21 and T12 so that
T21=-
 and
T12=-
 .
Hence individual inertances or compliances
satisfy equations 9.86 and 9.87.
Furthermore, from the combination rules of
section 9.9, it can readily
be seen that all combination of components with purely real T11 and
T22 and purely imaginery T21 and T12 will retain the same
properties. Consequently, any combination of inertance and compliance
satisfies equations 9.86 and 9.87 and is conservative.
-
A component or system will be considered ``completely
passive'' if ΔE is positive for
all possible values of
the inlet fluctuating total pressure and mass flow rate.
This implies that a net external supply of energy
to the fluid is required to maintain any steady state oscillation.
To find the characteristics of the transfer function which imply
``complete passivity'' the expression 9.83 is rewritten in the form
 | ......(9.88)
|
where x= /
/
 . It follows that the sign of
ΔE is determined by the sign of the expression in the square
brackets. Moreover, if Γ2 < 0, it is readily seen that this
expression has a minimum and is positive for all x if
 | ......(9.89)
|
which, since Γ2 < 0, implies Γ1 < 0. It follows
that necessary and sufficient conditions for a component or system to be
completely passive are
 | ......(9.90)
|
where
 | ......(9.91)
|
The conditions 9.90 also imply Γ2 < 0.
Conversely a ``completely active''
component or system which always has ΔE < 0 occurs if and only if
Γ1 > 0 and G < 0 which imply Γ2
> 0. These properties are not, of course, the only possibilities. A
component or system which is not completely passive or active could
be ``potentially active.'' That is to say,
ΔE could be negative for the
right combination of inlet fluctuating mass flow and total pressure,
which would, in turn,
depend on the rest of the system to which the particular component or
system is attached. Since Γ1 is almost always negative, it
transpires that most components are either completely passive or
potentially active, depending on the sign of the quantity, G, which will
therefore be termed the ``dynamic activity''.
These circumstances can be presented graphically as shown in
figure 9.3.
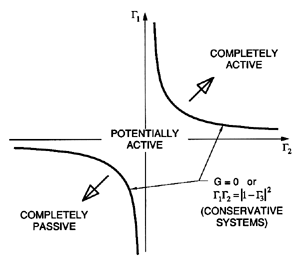
|
| Figure 9.3
Schematic of the conditions for completely active,
completely passive and potentially active components or systems.
|
In practice, of course, both the transfer function, and properties like the
dynamic activity, G, will be functions not only of frequency but also of
the mean flow conditions. Hence the potential for
system instability should
be evaluated by tracking the graph of G against frequency, and
establishing the mean flow conditions for which the quantity G becomes
negative within the range of frequencies for which transfer function
information is available.
While the above analysis represents the most general approach to the
stability of systems or components, the results are not readily interpreted
in terms of commonly employed measures of the system or component
characteristics. It is therefore instructive to consider two special
subsets of the general case, not only because of the simplicity of the
results, but also because of the ubiquity of these special cases. Consider
first a system or component that discharges into a large, constant head
reservoir, so that fluctuating total pressure at discharge is zero.
It follows from the expression 9.82 that
 | ......(9.92)
|
Note that ΔE is always purely real and that the sign only depends
on the real part of the ``input impedance''
 | ......(9.93)
|
Consequently a component or system with a constant head discharge will be
dynamically stable if the ``input resistance'' is
positive or
 | ......(9.94)
|
This relation between the net fluctuation energy flux, the input
resistance, and the system stability, is valuable because of the simplicity
of its physical interpretation. In practice, the graph of input
resistance against frequency can be monitored for changes with mean flow
conditions. Instabilities will arise at frequencies for which the input
resistance becomes negative.
The second special case is that in which the component or system begins
with a constant head reservoir rather than discharging into one. Then
 | ......(9.95)
|
and the stability depends on the sign of the real part of the ``discharge
impedance''
 | ......(9.96)
|
Thus a constant head inlet component or system will be stable when the
``discharge resistance'' is positive or
 | ......(9.97)
|
In practice, since T11 and T22 are close to unity for many
components and systems, both the condition 9.94
and the condition 9.97
reduce to the approximate condition that the system resistance,
Re{-T12}, be positive for system stability. While not always the
case, this approximate condition is frequently more convenient and more
readily evaluated than the more precise conditions detailed above and
given in equations 9.94 and 9.97. Note
specifically, that the system resistance can be obtained from steady state
operating characteristics; for example, in the case of a pump or turbine, it
is directly related to the slope of the head-flow characteristic and
instabilities in these devices which result from operation in a regime
where the slope of the characteristic is positive and
Re{-T12} is
negative are well known (Greitzer 1981) and have been described earlier
(section 8.6).
It is, however, important to recognize that the approximate stability
criterion Re{-T12} > 0, while it may provide a useful guideline in
many circumstances, is by no means accurate in all cases. One notable and
important case in which this criterion is inaccurate is the
auto-oscillation phenomenon described in
section 8.7. This is not
the result of a positive slope in the head-flow characteristic, but rather
occurs where this slope is negative and is caused by cavitation-induced
changes in the other elements of the transfer function. This circumstance
will be discussed further in section 9.14.
9.13 NON-CAVITATING PUMPS
Consider now the questions associated with transfer functions for pumps or
other turbomachines. In the simple fluid flows of
section 9.11 we were
able to utilize the known equations governing
the flow in order to construct the transfer functions
for those simple components. In the case of more complex fluids or
geometries, one cannot necessarily construct appropriate one-dimensional
flow equations, and therefore must resort to results derived from more
global application of conservation laws or to experimental measurements of
transfer matrices. Consider first the transfer matrix, [TP],
for incompressible flow through
a pump (all pump transfer functions will be of the [T] form defined in
equation 9.35) which will clearly be a function not only
of the frequency, ω, but also of the mean operating point as
represented by the flow coefficient, φ, and the cavitation number,
σ. At very low frequencies one can argue that the pump will simply
track up and down the performance characteristic, so that, for small
amplitude perturbations and in the absence of cavitation, the transfer
function becomes
 | ......(9.98)
|
where d(ΔpT)/dm is the slope of the steady state operating
characteristic of total pressure rise versus mass flow rate. Thus we
define the pump resistance, RP=-d(ΔpT)/dm, where RP is usually
positive under design flow conditions, but may be negative at low flow
rates as discussed earlier (section 8.6).
At finite frequencies, the elements TP21 and TP22 will continue
to be zero and unity respectively, since the instantaneous flow rate into
and out of the pump must be identical when the fluid and structure are
incompressible and no cavitation occurs. Furthermore, TP11 must
continue to be unity since, in an incompressible flow, the total pressure
differences must be independent of the level of the pressure. It follows
that the transfer function at higher frequencies will become
 | ......(9.99)
|
where the pump impedence, IP, will, in general, consist of a resistive
part, RP, and a reactive part, jω LP. The resistance,
RP, and inertance, LP, could be functions of both the frequency,
ω, and the mean flow conditions. Such simple impedance models
for pumps have been employed, together with transfer functions for the
suction and discharge lines (equation 9.73), to model the dynamics
of pumping systems. For example, Dussourd (1968) used frequency domain
methods to analyse pulsation problems in boiler feed pump systems.
More recently, Sano (1983) used transfer functions to obtain natural
frequencies for pumping systems that agree well with those observed
experimentally.
|
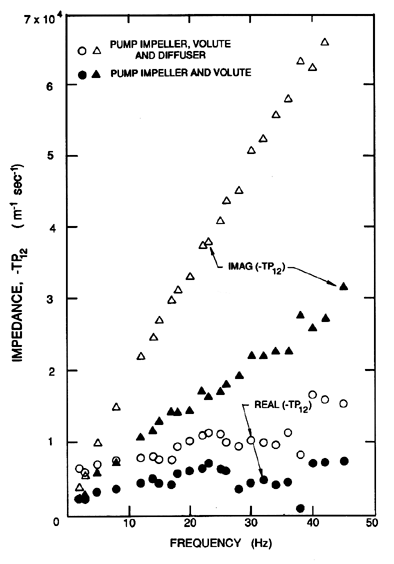
| Figure 9.4
Impedance measurements made by Anderson, Blade
and Stevans (1971) on a centrifugal pump (impeller diameter of 18.9cm)
operating at a flow coefficient of 0.442 and a speed of 3000rpm.
The real or resistive part of (-T12) and the imaginary or
reactive part of (T12) are plotted against the frequency of the
perturbation.
|
|
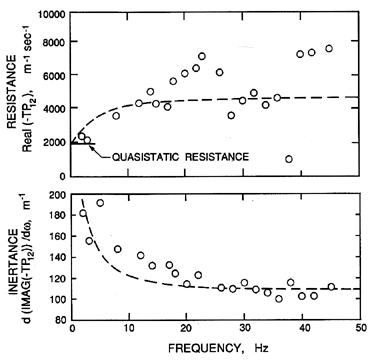
| Figure 9.5
Typical inertance and resistance values from the centrifugal
pump data of figure 9.4. Data do not include the
diffuser contribution. The lines correspond to analytical values obtained as
described in the text.
|
The first fundamental investigation of the dynamic response of pumps
seems to have been carried out by Ohashi (1968) who analyzed the oscillating
flow through a cascade, and carried out some preliminary experimental
investigations on a centrifugal pump. These studies enabled him to
evaluate the frequency at which the response of the pump would cease to
be quasistatic (see below). Fanelli (1972) appears to have been the first
to explore the nature of the pump transfer function,
while the first systematic measurements of
the impedance of a noncavitating centrifugal pump are those of Anderson,
Blade and Stevans (1971). Typical resistive and reactive component
measurements from the work of Anderson, Blade and Stevans are reproduced
in figure 9.4. Note that, though the resistance approaches the
quasistatic value at low frequencies, it also departs significantly
from this value at higher frequencies. Moreover, the reactive part is only
roughly linear with frequency. The resistance and inertance are presented
again in figure 9.5, where they are compared with the results of a
dynamic model proposed by Anderson, Blade and Stevans. In this model, each
pump impeller
passage is represented by a resistance and an inertance, and the volute by
a series of resistances and inertances. Since each impeller passage
discharges into the volute at different locations relative to the volute
discharge, each impeller passage flow experiences a different impedance on
its way to the discharge. This results in an overall pump resistance
and inertance that are frequency dependent as shown in figure 9.5.
Note that the comparison with the experimental observations (which are
also included in figure 9.5) is fair, but not completely satisfactory.
Moreover, it should be
noted, that the comparison shown is for a flow coefficient of
0.442 (above the design flow coefficient), and that, at higher flow
coefficients, the model and experimental results exhibited poorer agreement.
Subsequent measurements of the impedance of non-cavitating axial and mixed
flow pumps by Ng and Brennen (1978) exhibit a similar increase in the
resistance with frequency (see next section). In both sets of dynamic
data, it does appear that significant departure
from the quasistatic values can be expected when the reduced frequency,
(frequency/rotation frequency) exceeds about 0.02 (see figures
9.5 and 9.6). This is
roughly consistent with the criterion suggested by Ohashi (1968) who
concluded that non-quasistatic effects would occur above a reduced
frequency of 0.05 ZR φ/cos β. For the inducers of Ng and Brennen,
Ohashi's criterion yields values for the critical reduced frequency of about
0.015.
9.14 CAVITATING INDUCERS
In the presence of cavitation, the transfer function for a pump or inducer
will be considerably more complicated than that of equation 9.99.
Even at low frequencies, the values of TP11 will become
different from unity, because the head rise will change with the inlet
total pressure, as manifest by the nonzero value of
d(ΔpT)/dpT1 at a
given mass flow rate, m1. Furthermore, the volume of cavitation,
VC (pT1,m1), will vary with both the inlet total pressure, pT1
(or NPSH or cavitation number), and with the mass flow rate, m1
(or with angle of incidence), so that
 | ......(9.100)
|
Brennen and Acosta (1973, 1975, 1976) identified this quasistatic or low
frequency
form for the transfer function of a cavitating pump, and calculated values
of the cavitation compliance,
-ρL(dVC/dpT1)m1 and the
cavitation mass flow gain factor,
-ρL(dVC/dm1)pT1, using the
cavitating cascade solution discussed in
section 7.10.
Both the upper limit of frequency at which this quasistatic approach is
valid and the form of the transfer function above this limit cannot
readily be determined except by experiment. Though it was clear that
experimental measurements of the dynamic transfer functions were required,
these early investigations of Brennen and Acosta did highlight the
importance of both the compliance and the mass flow gain factor in
determining the stability of systems with cavitating pumps.
|
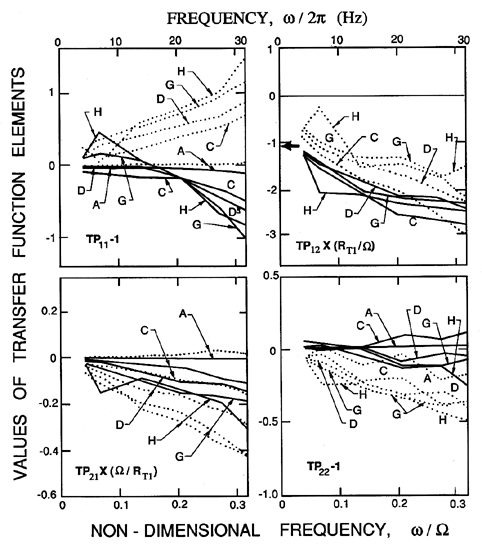
| Figure 9.6
Typical transfer functions for a cavitating inducer obtained
by Brennen et al. (1982) for a 10.2cm diameter inducer
(Impeller VI) operating at 6000rpm and a flow coefficient of φ1
=0.07. Data is shown for four different cavitation numbers, σ=
(A) 0.37, (C) 0.10, (D) 0.069, (G) 0.052 and (H) 0.044. Real and
imaginary parts are denoted by the solid and dashed lines respectively.
The quasistatic pump resistance is indicated by the arrow (adapted from
Brennen et al. 1982).
|
Ng and Brennen (1978) and
Brennen et al. (1982) conducted the first experiments to measure the
complete transfer function for cavitating inducers.
Typical transfer functions are those for the 10.2cm diameter
Impeller VI (see section 2.8), whose noncavitating
steady state performance was presented in figure 7.15. Transfer
matrices for
that inducer are presented in figure 9.6 as a function of frequency
(up to
32Hz), for a speed of 6000rpm, a flow coefficient φ1=0.07 and
for five different cavitation numbers ranging from data set A that was taken
|
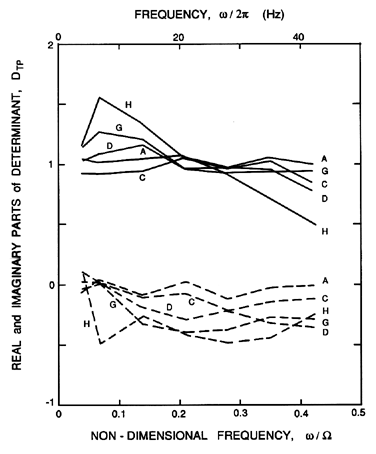
| Figure 9.7
Determinant, DTP, of the experimental
transfer functions of figure 9.6.
The real and imaginary parts are shown
by the solid and dashed lines respectively
and, as in figure 9.6, the
letter code A→H refers to steady state operating points with
increasing cavitation (adapted from Brennen et al. 1982).
|
under noncavitating conditions, to data set C that showed a little
cavitation, to data set H that was close to breakdown. The real and
imaginary parts are represented by the solid and dashed lines,
respectively. Note, first, that, in the absence of cavitation (Case A), the
transfer function is fairly close to the
anticipated form of equation 9.99 in which
TP11=TP22=1, TP21=0. Also, the impedance (TP12) is
comprised of an expected inertance (the imaginary part of TP12 is
linear in frequency) and a resistance (real part of -TP12) which is
consistent with the quasistatic resistance from the slope of the head rise
characteristic (shown by the arrow in figure 9.6
at TP12RT1/Ω=1.07). The resistance appears
to increase with increasing frequency, a trend which is consistent with
the centrifugal pump measurements of Anderson, Blade and Stevans
(1971) which were presented in figure 9.5.
|
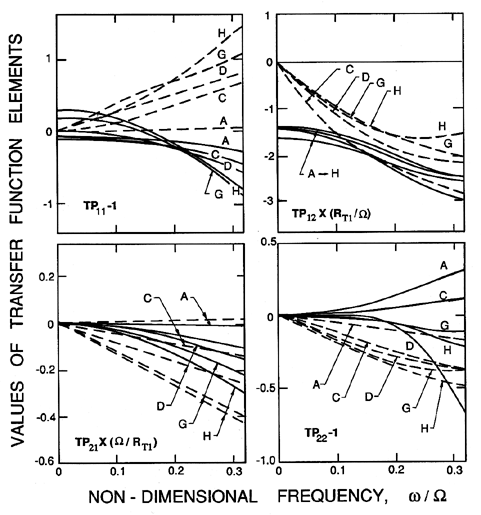
| Figure 9.8
Polynomial curves fitted to the experimental
data of figure 9.6 (adapted from Brennen et al. 1982).
|
It is also clear from figure 9.6 that, as the cavitation develops, the
transfer function departs significantly from the form of
equation 9.99.
One observes that TP11 and TP22 depart from unity, and develop
nonzero imaginary parts that are fairly linear with frequency. Also
TP21 becomes nonzero, and, in particular, exhibits a compliance which
clearly increases with decreasing cavitation number. All of these changes
mean that the determinant, DTP, departs from unity as the cavitation
becomes more extensive. This is illustrated in figure 9.7,
which shows the determinant corresponding to the data of figure 9.6.
Note that DTP is approximately unity for the non-cavitating case A, but that it progressively
deviates from unity as the cavitation increases. We can conclude that the
presence of cavitation can cause a pump to assume potentially active
dynamic characteristics when it would otherwise be dynamically passive.
Polynomials of the form
 | ......(9.101)
|
were fitted to the experimental transfer function data using values of
n* of 3 or 5.
To illustrate the result of such curve fitting we
include figure 9.8, which depicts the result of curve fitting
figure 9.6.
|
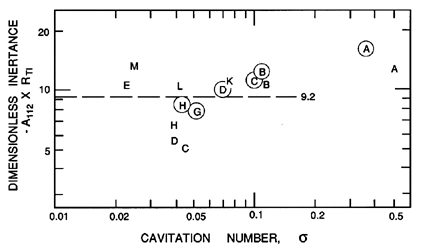
| Figure 9.9
The inertance, -A112, non-dimensionalized
as -A112 RT1, as a function of cavitation number for two
axial inducer pumps (Impellers IV and VI) with the same geometry but
different diameters. Data for the 10.2cm diameter Impeller VI is circled
and was obtained from the data of figure 9.6. The uncircled
points are for the 7.58cm diameter Impeller IV. Adapted
from Brennen et al. (1982).
|
|
| Figure 9.10
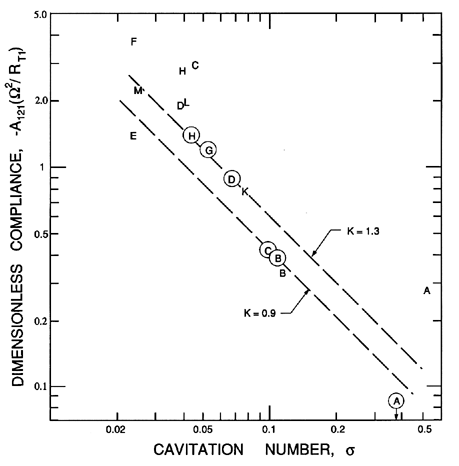
The compliance, -A121, nondimensionalized
as -A121Ω2/RT1 for the same circumstances as described in
figure 9.9.
|
We now proceed to examine several of the coefficients Anij that are
of particular interest (note that A011=A022=1, A021=0 for
reasons described earlier). We begin with the inertance, -A112,
which is presented nondimensionally in figure 9.9. Though there is
significant scatter at the lower cavitation numbers, the two different
sizes of inducer pump appear to yield similar inertances. Moreover, the
data suggest some decrease in the inertance with decreasing σ.
On the other hand, the corresponding data for the compliance, -A121,
which is presented in figure 9.10 seems roughly inversely
proportional to the cavitation number.
|
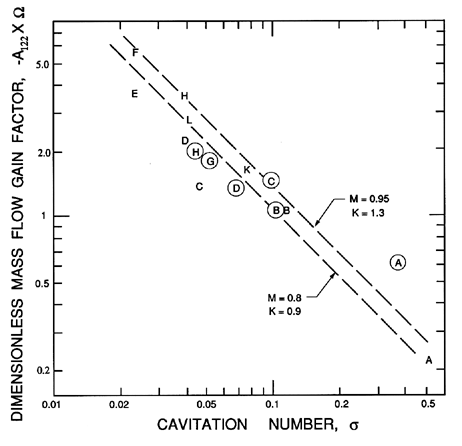
| Figure 9.11
The mass flow gain factor, -A122,
nondimensionalized as -A122Ω for the same circumstances as
described in figure 9.9.
|
|
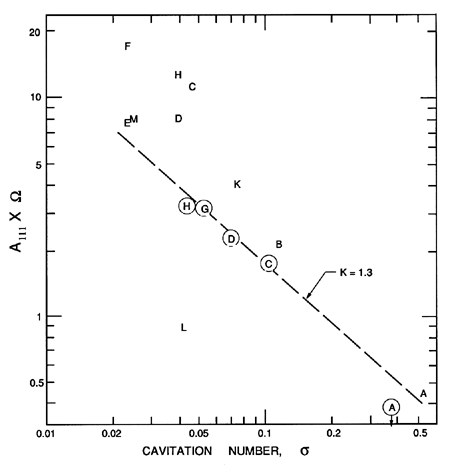
| Figure 9.12
The characteristic, A111,
nondimensionalized as A111Ω for the same circumstances as
described in figure 9.9.
|
And the same is true for both the
mass flow gain factor, -A122, and the coefficient that
defines the slope of the imaginary part of TP11, A111; these are
presented in figures 9.11 and 9.12, respectively. All of these
data appear to
conform to the physical scaling implicit in the nondimensionalization
of each of the dynamic characteristics.
It is also valuable to consider the
results of figures 9.9 to 9.12 in the
context of an analytical model for the dynamics of cavitating pumps
(Brennen 1978).
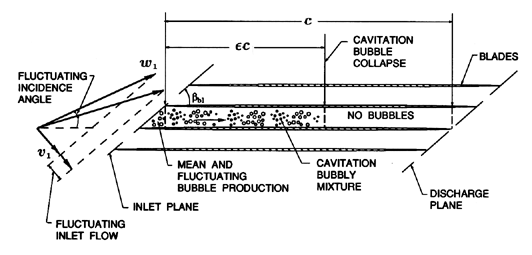
We present here a brief physical description of that
model, the essence of which is depicted schematically
in figure 9.13, which shows a developed, cylindrical surface within
the inducer. The cavitation is modeled as a bubbly mixture which
extends over a fraction, ε, of the length, c, of each blade
passage before collapsing at a point where the pressure has risen to a
value which causes collapse.
|
| Figure 9.13
Schematic of the bubbly flow model for the
dynamics of cavitating pumps (adapted from Brennen 1978).
|
The mean void fraction of the bubbly mixture
is denoted by α0. Thus far we have described a flow which is
nominally steady. We must now consider perturbing both the pressure and
the flow rate at inlet, since the relation between these perturbations,
and those at discharge, determine the
transfer function.
|
| Figure 9.14
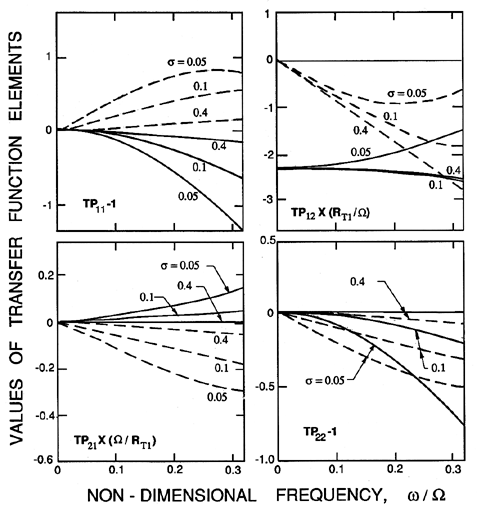
Transfer functions for Impellers VI and IV at
φ1=0.07 calculated from the bubbly flow model using K=1.3 and
M=0.8 (adapted from Brennen et al. 1982).
|
Pressure perturbations at inlet will cause pressure
waves to travel through the bubbly mixture and this part of the process is
modeled using a mixture compressibility parameter, K, to determine that
wave speed. On the other hand, fluctuations in the inlet flow rate
produce fluctuations in the angle of incidence which cause fluctuations in
the rate of production of cavitation at inlet. These disturbances would
then propagate down the blade passage as kinematic or concentration waves
which travel at the mean mixture velocity. This process is modeled by a
factor of proportionality, M, which relates the fluctuation in the angle
of incidence to the fluctuations in the void fraction. Neither of the
parameters, K or M, can be readily estimated analytically; they are,
however, the two key features in the bubbly flow model. Moreover they
respectively determine the cavitation compliance and the mass flow gain
factor, two of the most important factors in the transfer function
insofar as the prediction of instability is concerned.
The theory yields the following expressions for
A111, A112, A121
and A122 at small dimensionless frequencies (Brennen 1978,
1982):
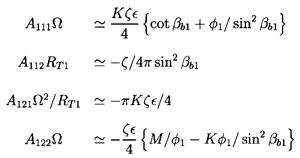 | ......(9.102)
|
where ζ=ℓ ZR/RT1 where ℓ is the axial length of the inducer,
and ZR is the number of blades. Evaluation of the transfer
function elements can be effected by noting that the experimental
observations suggest ε is approximately equal to
0.02/σ. Consequently,
the Anij characteristics from
equations 9.102 can be plotted against cavitation number. Typical
results are shown in
figures 9.9 to 9.12 for various choices of the two
undetermined parameters K and M.
The inertance, A112, which is shown in figure 9.9,
is independent of K and M. The calculated
value of the inertance for these impellers is about 9.2; the actual value
may be somewhat larger because of three-dimensional geometric effects that
were not included in the calculation (Brennen et al. 1982).
The parameter M only occurs in A122, and
it appears from figure 9.11 as though values of this parameter in
the range 0.8→0.95 provide the best agreement with the data.
Also, a value of K of about 1.3 seems to generate a good match with the data
of figures 9.10, 9.11 and 9.12.
Finally, since K=1.3 and M=0.8 seem appropriate values for these impellers,
we reproduce in figure 9.14 the complete
theoretical transfer functions for
various cavitation numbers. These should be directly compared with the
transfer functions of figure 9.8. Note that the general features of the
transfer functions, and their variation with cavitation number, are
reproduced by the model. The most notable discrepency is in
the real part of TP21; this parameter is, however, usually rather
unimportant in determining the stability of a hydraulic system. Most
important from the point of view of stability predictions, the cavitation
compliance and mass flow gain factor components of the transfer function
are satisfactorily modeled.
9.15 SYSTEM WITH RIGID BODY VIBRATION
All of the preceding analysis has assumed that the structure of the
hydraulic system is at rest in some inertial coordinate system. However,
there are a number of important problems in which the oscillation of
the hydraulic system itself may play a central role. For instance, one
might seek to evaluate the unsteady pressures and flow rates in a
hydraulic system aboard a vehicle undergoing translational or
rotational oscillations. Examples might be oil or water pumping systems
aboard a ship, or the fuel and hydraulic systems on an aircraft. In other
circumstances, the motion of the vehicle may couple with the propulsion
system dynamics to produce instabilities, as in the simplest of the
Pogo instabilities of liquid propelled rocket engines
(see section 8.13).
In this section we give a brief outline of how rigid body oscillations
of the hydraulic system can be included in the frequency domain
methodology. For convenience we shall refer to the structure of
the hydraulic system as the ``vehicle''.
There are, of course, more complex problems in which the
deformation of the vehicle is important. Such problems require
further refinement of the methods presented here.
In order to include the rigid body oscillation of the vehicle
in the analysis, it is first necessary to define a coordinate system,
x, which is fixed in the vehicle, and a separate inertial or
nonaccelerating coordinate system, xA. The mean location
of the origin of the x system is chosen to coincide with
the origin of the xA system. The oscillations of the vehicle
are then described by stating that the translational and rotational
displacements of the x coordinate system in the
xA system are respectively given by
 | ......(9.103)
|
It follows that the oscillatory displacement of any vector point,
x, in the vehicle is given by
 | ......(9.104)
|
and the oscillatory velocity of that point will be
 | ......(9.105)
|
Then, if the steady and oscillatory velocities of the flow in the
hydraulic system, and relative to that system, are given as in the
previous sections by
 and
and
 respectively, it follows that the oscillatory velocity of the flow
in the nonaccelerating frame,
 , is given by
 | ......(9.106)
|
Furthermore, the acceleration of the fluid in the nonaccelerating
frame,  , is given by
 | ......(9.107)
|
The last three terms on the right hand side are vehicle-induced
accelerations of the fluid in the hydraulic system. It follows
that these accelerations will alter the
difference in the total pressure between two nodes of the
hydraulic system denoted by subscripts 1 and 2. By integration one finds
that the total pressure difference,
( -
-
 ), is related to that which
would pertain in the absence of vehicle oscillation,
(
 -
-
 )0, by
 | ......(9.108)
|
where x2 and x1 are the locations of the
two nodes in the frame of reference of the vehicle.
The inclusion of these acceleration-induced total pressure changes is the
first step in the synthesis of models of this class of problems.
Their evaluation requires the input of the location vectors,
xi, for each of the system nodes, and the values of
the system displacement frequency, ω, and vibration amplitudes,
 and
and
 .
In an analysis of the response of the hydraulic system,
the vibration amplitudes would be included
as inputs. In a stability analysis, they would be initially unknown and
the system of equations would
need to be supplemented by those of the appropriate feedback mechanism.
An example would be a set of equations giving the unsteady thrust of an
engine in terms of the fluctuating fuel supply rate and pressure
and giving the accelerations of the vehicle resulting from that fluctuating
thrust. Clearly a complete treatment of such problems would be beyond the
scope of this book.
REFERENCES
-
Abbott, M.B. (1966). An introduction to the method of characteristics.
American Elsevier, New York.
-
Amies, G., Levek, R. and Struesseld, D. (1977). Aircraft hydraulic
systems dynamic analysis. Volume II. Transient analysis (HYTRAN).
Wright-Patterson Air Force Base Technical Report AFAPL-TR-76-43,
II.
-
Amies, G. and Greene, B. (1977). Aircraft hydraulic systems dynamic
analysis. Volume IV. Frequency response (HSFR). Wright-Patterson Air
Force Base Technical Report AFAPL-TR-76-43, IV.
-
Anderson, D.A., Blade, R.J. and Stevens, W. (1971). Response of a
radial-bladed centrifugal pump to sinusoidal disturbances for
non-cavitating flow. NASA TN D-6556.
-
Brennen, C.E. (1978). Bubbly flow model for the dynamic characteristics
of cavitating pumps. J. Fluid Mech., 89, Part 2, 223--240.
-
Brennen, C.E. and Acosta, A.J. (1973). Theoretical, quasistatic analyses
of cavitation compliance in turbopumps. J. of Spacecraft and Rockets,
10, No.3, 175--180.
-
Brennen, C.E. and Acosta, A.J. (1975). The dynamic performance of
cavitating turbopumps. Proc. Fifth Conference on Fluid Machinery,
Akademiai Kiado, Budapest, Hungary, 121--136.
-
Brennen, C.E. and Acosta, A.J. (1976). The dynamic transfer function for
a cavitating inducer. ASME J. Fluids Eng., 98, 182--191.
-
Brennen, C.E. and Braisted, D.M. (1980). Stability of hydraulic systems
with focus on cavitating pumps. Proc. 10th Symp. of IAHR, Tokyo,
255--268.
-
Brennen, C.E., Meissner, C., Lo, E.Y., and Hoffman, G.S. (1982). Scale
effects in the dynamic transfer functions for cavitating inducers.
ASME J. Fluids Eng., 104, 428--433.
-
Brown, F.T. (1967). A unified approach to the analysis of uniform
one-dimensional distributed systems.
ASME J. Basic Eng., 89, No. 6,
423--432.
-
Dussourd, J.L. (1968). An investigation of pulsations in the boiler
feed system of a central power station. ASME J. Basic Eng.,
90, 607--619.
-
Fanelli, M. (1972). Further considerations on the dynamic behaviour of
hydraulic turbomachinery. Water Power, June 1972, 208--222.
-
Greitzer, E.M. (1981). The stability of pumping systems---the 1980
Freeman Scholar Lecture.
ASME J. Fluids Eng., 103, 193--242.
-
Hennyey, Z. (1962). Linear electric circuits. Pergamon Press.
-
Martin, C.S. (1978). Waterhammer in steam generators and feedwater
piping. Paper presented at Steam Generator Waterhammer Workshop,
EPRI, Palo Alto, Cal.
-
Ng, S.L. and Brennen, C.E. (1978). Experiments on the dynamic behavior of
cavitating pumps.
ASME J. Fluids Eng., 100, No. 2, 166--176.
-
Ohashi, H. (1968). Analytical and experimental study of dynamic
characteristics of turbopumps. NASA TN D-4298.
-
Paynter, H.M. (1961). Analysis and design of engineering systems. MIT
Press.
-
Pipes, L.A. (1940). The matrix theory for four terminal networks.
Phil. Mag., 30, 370.
-
Pipes, L.A. (1963). Matrix methods for engineering. Prentice-Hall,
Inc., NJ.
-
Safwat, H.H. and van der Polder, J. (1973). Experimental and analytic
data correlation study of water column separation. ASME J. Fluids
Eng., 95, 91--97.
-
Sano, M. (1983). Pressure pulsations in turbo-pump piping systems.
Experiments on the natural frequencies of the liquid columns in
centrifugal pump piping systems. Bull. JSME, 26, No.222,
2129--2135.
-
Strecker, F. and Feldtkeller, R. (1929). Grundlagen der Theorie des
allgemeinen Vierpols. Elektrische Nachrichtentechnik, 6, 93.
-
Streeter, V.L. and Wylie, E.B. (1967). Hydraulic transients.
McGraw-Hill.
-
Streeter, V.L. and Wylie, E.B. (1974). Waterhammer and surge control.
Ann. Rev. Fluid Mech., 6, 57--73.
-
Tanahashi, T. and Kasahara, E. (1969). Analysis of water hammer with
water column separation. Bull. JSME, 12, No.50, 206--214.
-
Weyler, M.E., Streeter, V.L., and Larsen, P.S. (1971). An investigation
of the effect of cavitation bubbles on the momentum loss in transient
pipe flow. ASME J. Basic Eng., 93, 1--10.
-
Wiggert, D.C. and Sundquist, M.J. (1979). The effect of gaseous cavitation
on fluid transients. ASME J. Fluids Eng., 101, 79--86.
Back to table of contents
Last updated 12/1/00.
Christopher E. Brennen


 | «
| «
 ,
|
,
|  | «
| «
 , etc.), they can be readily
superimposed,
so a summation over many frequencies is implied in the above expressions.
In general, the perturbation quantities will be functions of the mean flow
characteristics as well as position, s, and frequency, ω.
 }, n=1,2→ N denotes the vector of independent
fluctuating quantities at inlet and discharge for a system of order N,
then the transfer matrix, [T], is defined as

 , and the mass flow rate,
 ,
then a convenient transfer matrix is

 , or the instantaneous total
pressure,
 . Note that these are
related by

 is the mean density,
 is the
fluctuating density which is barotropically connected to
 , and
z is the vertical elevation of the system node. Neglecting the
 terms as is acceptable for
incompressible flows

 ,
the fluctuating volume flow rate or the fluctuating mass flow rate,
 .
Incompressible flow at a system node in a rigid pipe implies

 ,
,
 } or
{
 ,
,
 }, and, for these two vectors,
we will respectively use transfer matrices denoted by [T*] and
[T], defined as


 .
If, in addition, mixing losses at the downstream junction are neglected,
so that the fluctuating total pressure,
 , can be equated with
the fluctuating total pressure at discharge from the two components, then
the transfer function, [TS], for the combination of two components
(order two transfer functions denoted by [TA] and [TB])
becomes

 . The resulting equation
will take the form


 ,
which behaves according to the polytropic index, k, it follows that

 is the mean pressure
level. In the case of a surge tank in
which the free surface area is AS, it follows that


 is the mean fluid
velocity,
M=
 /c is the Mach
number, and θ is a reduced frequency given by


 and
T22=
 ,
and purely imaginery T21 and T12 so that
T21=-
 and
T12=-
 .
Hence individual inertances or compliances
satisfy equations 9.86 and 9.87.
Furthermore, from the combination rules of
section 9.9, it can readily
be seen that all combination of components with purely real T11 and
T22 and purely imaginery T21 and T12 will retain the same
properties. Consequently, any combination of inertance and compliance
satisfies equations 9.86 and 9.87 and is conservative.

 /
/
 . It follows that the sign of
ΔE is determined by the sign of the expression in the square
brackets. Moreover, if Γ2 < 0, it is readily seen that this
expression has a minimum and is positive for all x if


 and
and
 respectively, it follows that the oscillatory velocity of the flow
in the nonaccelerating frame,
 , is given by

 , is given by

 -
-
 ), is related to that which
would pertain in the absence of vehicle oscillation,
(
 -
-
 )0, by

 and
and
 .
In an analysis of the response of the hydraulic system,
the vibration amplitudes would be included
as inputs. In a stability analysis, they would be initially unknown and
the system of equations would
need to be supplemented by those of the appropriate feedback mechanism.
An example would be a set of equations giving the unsteady thrust of an
engine in terms of the fluctuating fuel supply rate and pressure
and giving the accelerations of the vehicle resulting from that fluctuating
thrust. Clearly a complete treatment of such problems would be beyond the
scope of this book.